Daemons - Color Plane
- thomas (Unlicensed)
"Color Plane" is a tool for visualizing various properties of a particle-based fluid. It provides to make attributes like pressure, density, velocity and temperature visible. It is also the only daemon that has an export option under → "Export Central". You can decide whether you want to store the numerical data or an image sequence.
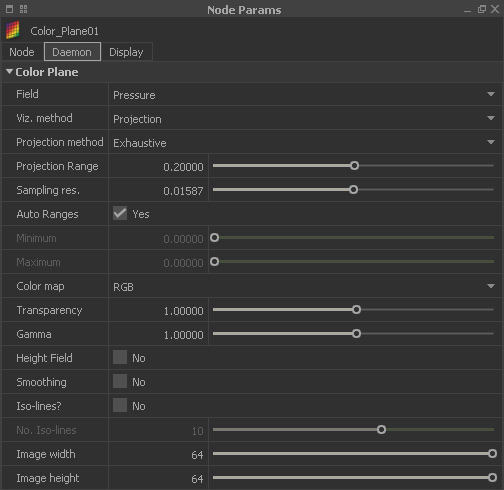
Field
You can choose which fluid attribute you want to visualize: “Pressure”, “Density”, “Velocity”, “Velocity x, y, z” and “Temperature” (only available with standard particle fluids → gas particles).
Viz. method
The daemon's “Color Plane” section comes in two flavours depending on the chosen “Viz. method:
- “Projection” draws the field values from particles onto the viewport gizmo. Only particles within a fixed vertical distance of the plane contribute to the final plane colours.
- “Interpolation” blurs the individual sample locations and provides a more accurate representation of the chosen field.
Projection method (only available with Viz. method = Projection)
“Exhaustive” examines all emitter particles to determine those which can contribute to the plane colour values. “Local” searches locally for the particles that will be considered for the final colour values - the maximum and minimum values are local maxima and minima. The “Local” mode is recommended for large particle counts.
Projection range (only available with Viz. method = Projection)
Particles with a vertical distance smaller than this value are used for printing marks on the plane, others are ignored. The range is displayed in the form of vertical lines at the viewport gizmo's corners.
Sampling res.
This is the colour field's resolution. The smaller the value, the better the field's quality.
Auto ranges
Their mode of operation is exactly the same as with an emitter's “Display” features. When set to “No” you have access to the “Minimum” and “Maximum” parameters and you are able to set threshold for the particle samples.
Minimum
This is the field's lower threshold. All samples from particles with values smaller than “Minimum” will be drawn with the same colour. The parameter also influences the daemon's “Heightfield” representation.
Maximum
This is the field's upper threshold. All samples from particles with values greater than “Maximum” will be drawn with the same colour. The parameter also influences the daemon's “Heightfield” representation.
Color Map
Choose, how the map will be drawn: “RGB”, “Grayscale”, and “B(lack)&W(hite)”.
Transparency
This value can range between 1.0 (opaque) and 0.0 (completely transparent) and controls the viewport gizmo's opacity.
Gamma
Change the “Gamma” value to enhance the colour area's contrast.
Height Field
When checked the normalized values are displayed as coloured 3-dimensional peaks.
Smoothing
This option interpolates the field values to achieve a more continuous distribution of colours and the height field.
Iso-lines?
Areas with identical field values (pressure, velocity, density etc.) are drawn as lines of equal colour similar to a contour map.
No. Iso-lines
The default number of “Iso-lines” is 10. You can alter this value to your needs.
Image width
This value defines the width of the exported field map.
Image height
This value defines the height of the exported field map.