Batch Graph
- thomas (Unlicensed)
- Alex Ribao
RealFlow's “Graphs” is a visual programming system where nodes are connected to achieve a result. Every node represents a specific function, e.g. getting a scene's emitters or objects, accessing particles, reading out channel data, or storing image maps. For a full list of nodes please hit the Tab key.
Batch graphs are mainly used to complete repetitive tasks, for example parameter changes, import of objects, applying colours, normalizing channels, object creation and manipulation, and so on. All these tasks do not need a simulation and they can be executed “offline”.
Jump to
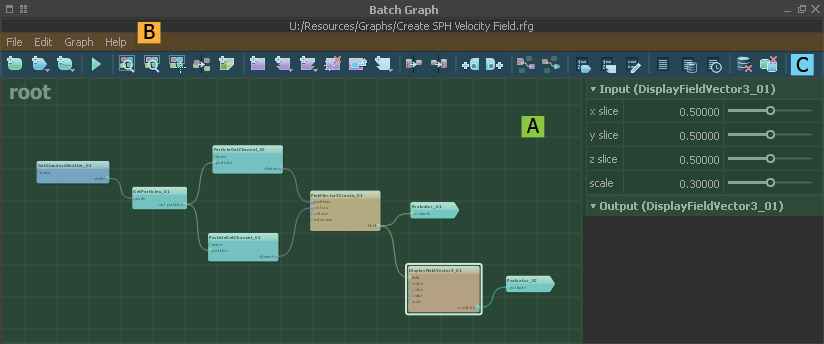
Canvas and Parameter Section (A)
The canvas has a background grid and contains your nodes and graphs. When you click on a node you will see its available parameters in the area on the right. There you will find slider and input for customizing a node's initial settings.
Batch Graph Menu (B)
The great majority of menu entries is self-explaining and can be found in many other applications. Therefore we want to focus on the most important commands.

File
Load, save, and export your graph; open the → graph preferences.
Import as Compound...
Instead of opening a new file and replacing the current content, a file can also be added to the graph as a compound. A compound can be seen as a group of nodes.
Export Current Level to Library...
With this function it is possible to save an entire level (“Root”, “Compound”...) and hook it to the “Tab” menu. From there, it can be accessed and reused.
Open Node Library Folder...
Open the node library folder and add nodes with drag and drop actions. Then the graph will be added as a compound.
Edit
Copy, paste, and cut parts of the graph.
Graph
Clear
Removes the entire graph from the editor. This action cannot be undone!
Run
Execute the graph.
Help
Here you will find a link to RealFlow's internal graph reference – a compilation of all available commands.
Batch Graph Icon Bar (C)
Here you have access to common nodes and features, e.g. evaluator and interface nodes, graph messages, zoom functions, notes, and a button for executing the graph.
![]()
Place the mouse over an icon for a tooltip.