Network System - Technology Preview
FEATURE IN TECHNOLOGY PREVIEW STAGE

Render courtesy of Wieger Poutsma - FISK Imaging (www.fisk-imaging.com). Agency: Selmore - The Others. Client: Leaseplan
In high-end productions, it is often necessary to distribute a render job over a number of machines in a farm to quickly obtain all the frames needed for a sequence or to calculate a very large image. The new Network System - Technology Preview represents a prototype of a more powerful and more flexible multi-platform network system, allowing a mixture of Windows, Mac and Linux systems to be connected together. The new TP Network System (stands for Technology Preview) uses the most advanced algorithms in network communications that provide a more robust and stable performance and a more flexible usage, while maintaining the all the functionalities of the old Network System: render queue management, constant preview display and of course Single, Cooperative and Animation jobs:
- Single job: Launch a non-cooperative render queue, distributing the MXS scenes among the available CPUs, but every CPU renders an independent image. Each machine works on its own MXS scene.
- Cooperative job: Launch a cooperative render with several machines working together to render the same image. The contributions of the machines are merged to a single image thanks to the unique capabilities of Maxwell to merge different renders.
- Animation job: Launch an animation, distributing the frames among the CPUs in the farm to get the whole frame range.
Keep in mind that this Technology Preview application is currently a prototype so, while fully functional, some of its features can be still under development or under testing. For professional production tasks, we still suggest to use the previous Network System.
Network rendering is only available on Floating licenses.
How does the new TP Network work?
Take a look at how this feature works in this video overview.
TP Network overview
The Agents
![]()
The new Network System (tp_network.exe in Windows, tp_network in Linux and tp_manager.app, tp_monitor.app and tp_rendernode.app in Mac) is composed of three different agents:
- TP Manager: the service that distributes the jobs between the available render nodes. It also merges the images in a cooperative render.
- TP Monitor: one of the main differences in this new system is that the Monitor is now a web interface, launched from your preferred web browser, where you can add jobs, assign jobs to nodes, stop a network render, display info about the current job and show a merged preview of a network render in progress. Being a web interface, it allows you to comfortably manage your network rendering from your desktop, laptop, tablet or smartphone without the need of installing any specific application.
- TP Render Nodes: the slave computers that actually render the frames.
Starting up the TP Network System
To start up the TP Network System, you simply have to launch the Manager, the Monitor or a Render Node on a computer by clicking on the appropriate shortcut (tp_manager, tp_rendernode, tp_monitor). In Windows and Linux you can also click on the generic tp_network application, and then select which mode to run from the menu. The tp_monitor shortcut launches your default web browser and automatically gets connected to the Manager in use to allow you control your queue.
Please note that a computer that runs the Manager and/or the Monitor can also be used as a Render Node at the same time. The TP Network can render across a mixed network of computers running Windows, Mac, and Linux. Only one instance of each type (Manager, Monitor or Node) can be running in the same machine at the same time. Several Monitors, however, can run at the same time in the network, but on different machines. This allows you to add jobs and control the network rendering from several different machines.
Step 1: Launch the Manager
To launch the Manager agent, simply click on the tp_manager orange icon or execute the tp_nextwork application (the generic network application container) and choose to run it in Manager mode in the popup menu (Windows and Linux only).
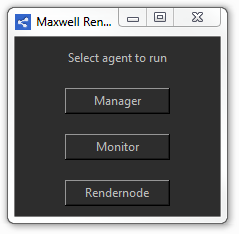
Choosing the agent to run when launching the tp_network application directly
Once the Manager is launched, you will be first prompted to indicate the network Shared folder. It is a common folder, shared by all the computers in the network so they all must be able to access that common folder without restrictions, and where the input files (scenes, dependencies, etc) and the output files (renders) have to be stored. You can type there the shared folder path (i.e. \\myRepository\myProjects\to_render), a mounted drive (i.e. Z:/) or use the "Select" button to browse to the folder you want to define as the Shared folder.
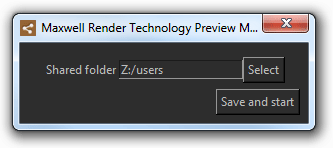
Defining the Shared folder of your network
Hit "Save and start" and the Manager will start up. When the Manager service is running, its console panel appears displaying information about the course of the process and outputting crucial messages in case of any problem. Some of the more important information in this panel is the Manager IP address (displayed in the first line, in the example here, where it indicates "Using IP address 192.168.0.237") that will be essential later to launch the Monitor and Rendernodes. Another important data is the communication port used to communicate with the Monitor web interface (in this example, where it indicates "websocket_port 45448").
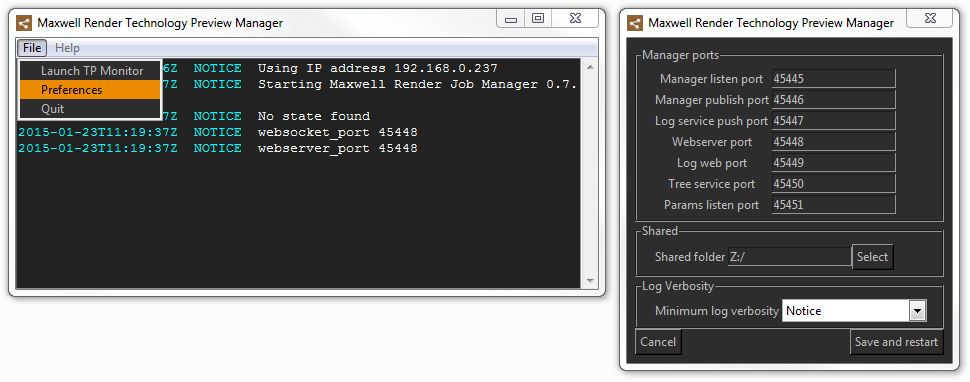
The TP Manager console panel (left) and its Preferences panel (right)
In the Manager main menu bar, the File menu allows to launch the TP Monitor directly from there, open the Manager Preferences panel or Quit the application, while the Help menu leads you to this Documentation resource. The Preferences panel (above right) allows you to change the communication ports that the TP_Network needs to have opened to establish the proper communications among its agents. By default, it uses ten ports in the range 45444-45453, but they can be customized in this panel. The most important one is the Webserver port (by default set to be the 45448, although you can customize it here), used to connect with the Monitor on a web browser.
Some other interesting information here are the Shared folder and set the verbosity of the log messages. The other data displayed in this panel are the other communication ports
NEW! While only one Manager process can be launched on certain computer, you can have several Managers computers running at the same time in your network, and assign at which Manager each node will be connected as we'll describe in the next section.
Step 2: Launch the Rendernodes
To launch the Rendernode agent, simply click on the tp_rendernode green icon or execute the tp_nextwork application (the generic network application container) and choose to run it in Rendernode mode in the popup menu as shown above (Windows and Linux only).
When the Rendernode is launched, it needs to know two crucial data: the Manager IP address computer (as we detailed in the previous section) and the Shared folder where the scenes and dependencies are, and where the output renders will be stored. You can manually input the Manager IP address or use the "Detect" button to proceed to an automatic detection accross your network.
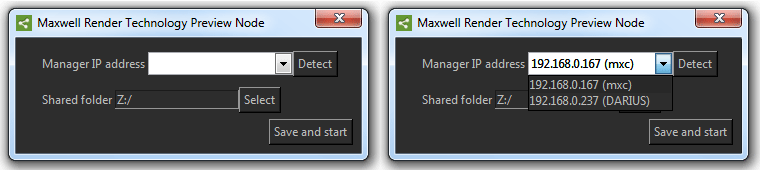
Indicating the Manager IP and the Shared folder. After the auto-detection, you can choose the IP of the Manager from the detected managers list (right).
Hit "Save and start" and the Rendernode process will start up. Just like the Manager, when the Rednernode service is running, its console panel appears displaying information about the course of the process and outputting crucial messages in case of any problem. Some of the more important information in this panel is the Manager IP address (in this example where it indicates "Connecting to Manager at IP address 192.168.0.237").
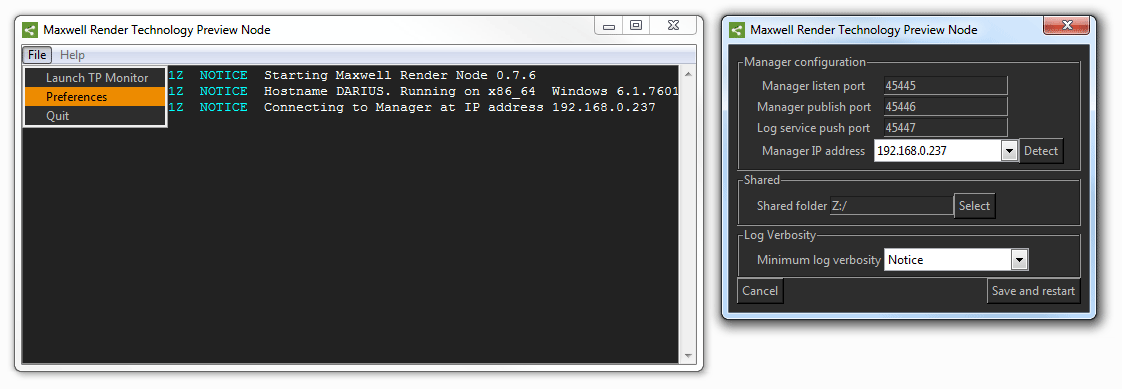
The TP Rendernode console panel (left) and its Preferences panel (right)
If the detection of the Manager has succeeded, the Shared folder is automatically taken from the Manager settings. Like in the Manager main menu bar, the File menu here allows to launch the TP Monitor directly from there, open the Rendernode Preferences panel or Quit the application, while the Help menu leads you to this Documentation resource. The Preferences panel (above right) allows you to change the communication ports used to connect with the Manager and the IP of the Manager to get connected to. Here you can also change the Shared folder and set the verbosity of the log messages.
You can have as many Rendernodes running in your network as computers with Maxwell installed you have, obviously limited b the number of nodes available in your Floating license. In one computer, only one single Rendernode process can be launched at the same time.
Step 3: Launch the Monitor
As mentioned above, one of the most important features in the new TP Network is that the Monitor is in fact a web service, so thus it can be run on any web browser, giving you to control to manage your render queue from your desktop, laptop, tablet or smartphone without the need to install any specific component.
To launch the TP Monitor, open your preferred web browser and type in the main address bar: xxx.xxx.xx.xx:45448
where xxx.xxx.xx.xx is the IP of the TP Manager computer, that we've noticed when we launched the Manager in the first step, and 45448 corresponds to the communication port defined in the Manager Preferences panel as we mentioned. By default this webserver port is set to be the 45448, but you can easily set a different one if you want in the Preferences panel of the TP Manager.
In the example above launching the Monitor would look similar to:

You can also access to the Monitor by executing the tp_nextwork application (the generic network application container) and choose to run it in Monitor mode in the popup menu as shown above (Windows and Linux only), that will automatically launch your web browser linked to the given Manager IP. In Mac you have a tp_monitor blue icon available to launch automatically the service on your web browser. As a third way, from any Manager or Rendernode main menu bar (in File>Launch TP Monitor). You will get something like this in your web browser:
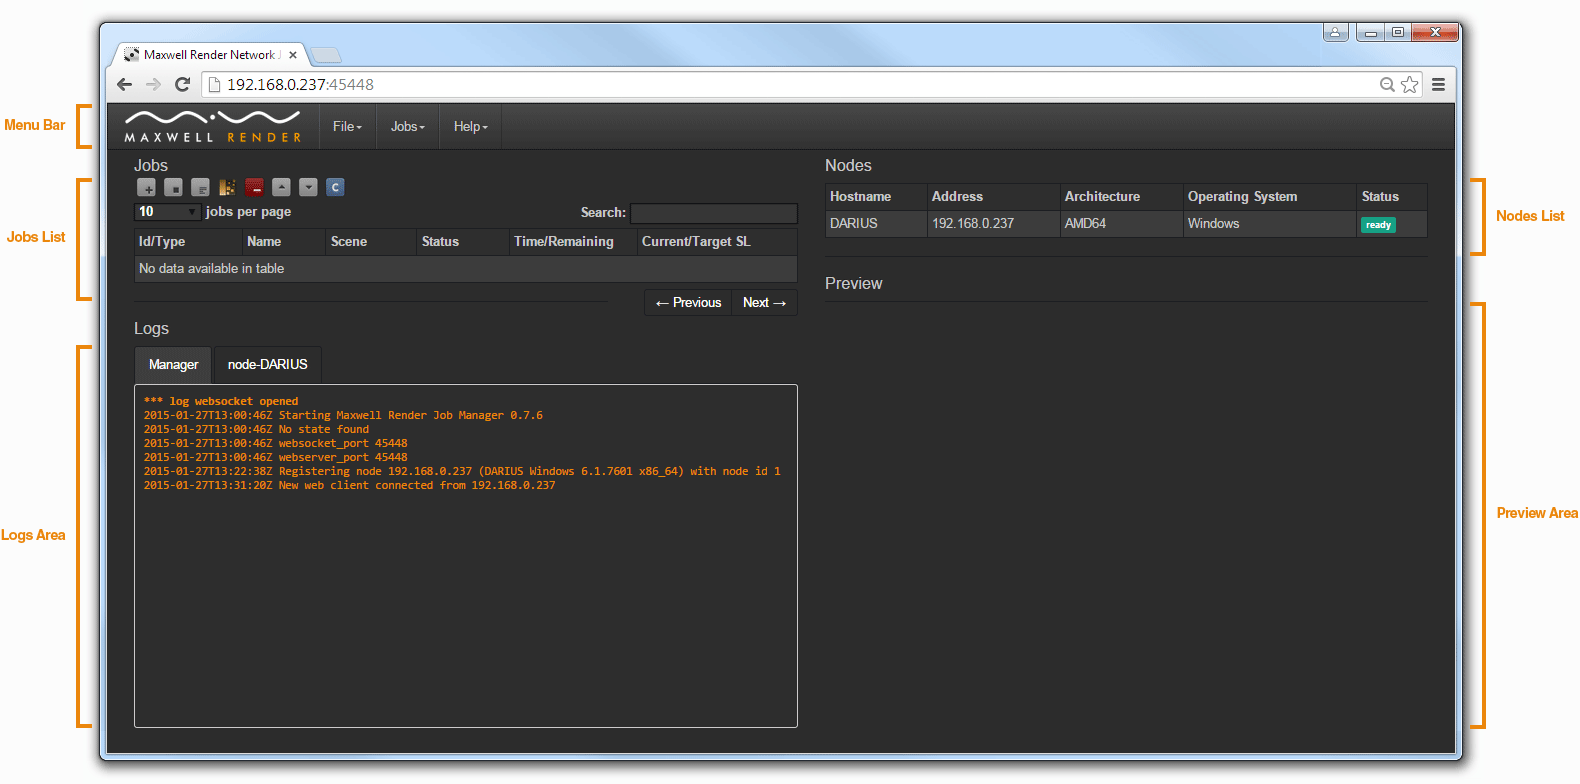
TP Monitor in a Google Chrome browser. The TP Monitor interface is split in five main areas: the main Menu bar, the Jobs list, the Nodes list, the Logs area and the Preview area.
As you can see in the image above, the TP Monitor interface is split in five major areas: the main Menu bar, the Jobs list, the Nodes list, the information Logs area and the Preview area.
Main Menu bar
From the main Menu bar you have access to:
- File: to save the Manager and all the Rendernodes logs together into a Zip file that is stored on your default downloads folder
- Jobs: from this menu you can add, stop, edit, resume, remove jobs and arrange their priority in the queue
- Help: general information about the software and version and a direct link to this Documentation resource.
The Jobs list
This panel represents your render queue, detailing the jobs you submitted and information about them: scene, status, time passed and remaining, current and target SL. You can search among your jobs by name and define how many jobs are listed per page.
The Nodes list
A list of all the Rendernodes connected to the same Manager this Monitor is connected to, and information about them: name, IP, architecture, operating system and status. The nodes in this list are the ones that are available for the jobs submitted from this Monitor.
The Logs area
The TP Monitor can display simultaneously the logs of the Manager and all the Rendernodes at the same time, arranged in tabs, so you can control the behavior of all the network components from one single panel. If any problem arises, it will be displayed in the corresponding log (regarding the verbosity level you defined in each agent Preferences panel), and you can save all the logs (from the Manager and all the Rendernodes) into one single Zip file with just one click (File>Save Logs).
The Preview area
Previewing renders on-demand while there are still in process has always been one of the more powerful features on the previous Network System, as it gives you real-time information about how you render is looking, that allows you to prolong its SL if you consider, or even stop it if you find it is ready, saving you a considerable unnecessary time.
In this version we've improved this feature to make it even better. Now any job in course will constantly and automatically send a preview image, so you can control the advance of all your jobs with constant fresh information in real time. The first preview is sent when the render reaches SL=4 and continues sending at each integer SL value (4, 5, 6, 7..), so you don't need to manually order it, which is particularly interesting in animations. The previews are all displayed in different tabs in the Preview area, making it the render management better and easier that even.
Step 4: Submitting a job
At this step, submitting jobs is pretty easy. Go to the Jobs menu in the Main Menu bar and hit Add to submit a new job to the render queue. Choose the type of job (Single, Cooperative or Animation job) and pick the file to render in the Shared folder tree. Finally, in the Render Options panel, you can adjust the render settings (like the camera, resolution, time, Sampling Level, Multilight mode or extra channels, and specifically the output path for the final image and MXI render files) or just accept the values exported in the MXS. Hit "Submit" and your job will be added to the queue and will be listed in the Jobs list.
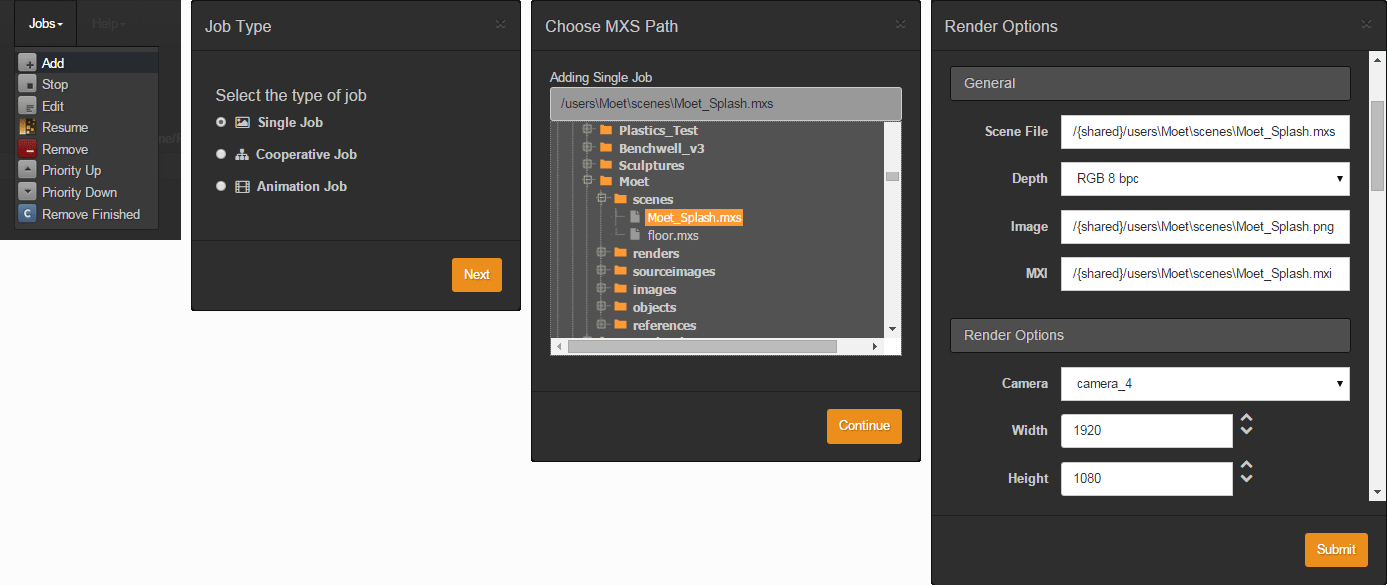
Submitting a job in the TP Network
Launching TP Network Rendernode via command line
To launch the render nodes via command line you have to execute the command:
tp_network.exe render
where you can input the following parameters:
-M [to indicate the IP of the Manager]
-s [path to the shared folder]
-v [to set the verbosity level for the message logs]
-np [to disable the sending of the dependenciy files]
The two first parameters (-M and -s) are mandatory for the Rendernode to work.
The supported web browsers by the TP Monitor are:
- Google Chrome 27 or later
- Mozilla Firefox 30 or later
- Safari 6.1 or later
- Internet Explorer 10 or later.
For mobile devices: IOS 6.1 or later on an Apple device to use the default browser. On Android, the default browser only works from Android 4.4 onwards.